Gartner and the Future of AI: Forecasts, Measurements and a Critical Perspective
What does Gartner forecast, and how have its estimates changed? A historical comparison, METR’s measurements of AI capabilities, Anthropic’s research on workplace tasks, and our critical perspective in nine infographics.
Three different questions about the future of AI
Skills, company productivity and jobs have different metrics. A single curve does not fit them.
Our opinion: Gartner helps organize the topics. Time estimates need historical verification and comparison with measured results.
I have been following Gartner's curves for several years. They help me organize the technological topics, but with them I gradually come back to one question: if a certain approach is repeatedly expected to mature in two to five years, is it really getting closer to the goal, or is the deadline itself shifting? This year I was particularly interested in the composite AI. Its name sounds current, but we have known the combination of different artificial intelligence methods for a long time.
I see a similar tension between the rapid growth of model capabilities and the more cautious forecasts of enterprise deployment. Both can be true at the same time: AI can handle increasingly demanding tasks, and a particular company may still not achieve the expected benefit. In order to know when caution is appropriate and when it is lagging behind development, we need measurements and a look at history in addition to forecasts.
In its October 2026 overview, Gartner highlights a shift in focus to accountability for AI behavior, its cost and governance. Agents, robotics and new models continue to attract interest, but at the same time expose weaknesses in corporate data, security and work organization. Gartner on the major shift in AI in 2026.
To understand this development, it is necessary to distinguish several different maps. The general curve of artificial intelligence captures technological trends. Other overviews cover generative AI, agent systems, and AI in the physical world. A separate Future of Work curve also explores skills, people management and the human relationship with automation. Their topics overlap, but they do not answer the same question.
First, I'll explain Gartner's categories and compare them to estimates from IDC, Forrester, Deloitte, McKinsey, and AI vendors. I then add METR measurements, job research from Anthropic, and eight historical examples from 2011-2026; for composite AI, I will compare the years 2020, 2023 and 2026. At the end, I will separate my own critical reflection from the claims of individual institutions.
The article was published on November 10 and expanded by November 11, 2026. It is based on public reports, data and charts; for the years 2011, 2020 and 2023, also from publicly available reprints of the original reports. Gartner's full 2026 paid profiles are not the basis of this analysis. Technical explanations, own breakdowns and authorial reflection are distinguished from source forecasts.
How to read the expectation curve
Gartner's model has five stages. The table describes what happens in each stage.
| Phase | What does it express? |
|---|---|
| Innovation Trigger | New possibilities, first attempts and significant interest will appear. The practical applicability is uncertain. |
| Peak of Inflated Expectations | Successful demos create the impression of rapid and extensive transformation. Expectations run ahead of operating experience. |
| Trough of Disillusionment | Limits, costs and failed projects will show. Some of the suppliers and users are eliminated. |
| Slope of Enlightenment | There is an increase in repeatable processes and a clearer idea of where technology brings value. |
| Plateau of Productivity | Established usage and better known conditions of economic benefit are expanding. |
It is a management framework for thinking about maturity and adoption. The vertical axis shows expectations; horizontal represents the progress of development without a regular calendar scale. The specific time estimate is indicated by the tag next to the item. Official explanation of Gartner's methodology.
This results in important limitations of interpretation. A drop in the curve does not mean a drop in computing power or degradation of all products. The technology in the valley can be very useful for a certain task. A technology at the peak, on the other hand, may not be ready for widespread deployment. The height of the point does not indicate the level of danger, sales or probability of success.
The time must be read with the same caution. "Two to five years to productivity" is not the date of invention, first product, or first profitable contract. It is an estimate of the remaining path to the broader maturity of the respective category. For the August 2026 chart, the intervals can be roughly converted as follows:
| A mark in the chart | Approximate calendar meaning |
|---|---|
| Less than two years | Outlook until approximately the second half of 2028 |
| Two to five years | Around 2028 to 2031 |
| Five to ten years | Approximately 2031 to 2036 |
| More than ten years | Beyond the horizon of 2036 |
This conversion is a simple recalculation of the intervals, not another prediction. The intervals are not statistical confidence intervals. For a specific company, the result can appear significantly earlier, later, or not at all.
Therefore, even the marker for foundation models does not mean that companies will start using them in two years. A McKinsey survey published in March 2025 already reported that 71 percent of respondents report regular use of generative AI in at least one business function. These are the surveyed organizations, not a census of all companies. Widespread use and foreseeable economic benefit are different things. At the same time, the analyst should explain according to which observable criteria the plateau will already be reached. Without it, the estimate is difficult to verify. McKinsey: using generative AI in organizations.
When Gartner expects broader productivity
Estimates from August 2026. Technologies can be used today; the graph does not say when they will be invented.
The term productivity is not the term invention. This is an approximate recalculation of intervals from August 2026. For general AI, this is not a prediction of the date of its creation.
Custom infographic by Gartner's 2026 chart, page 3.What exactly is in the technology map for 2026
A general report on AI was published by August 28, 2026. The graph itself shows the situation in August. This is important to distinguish from the October article which popularizes the report. Gartner report public record.
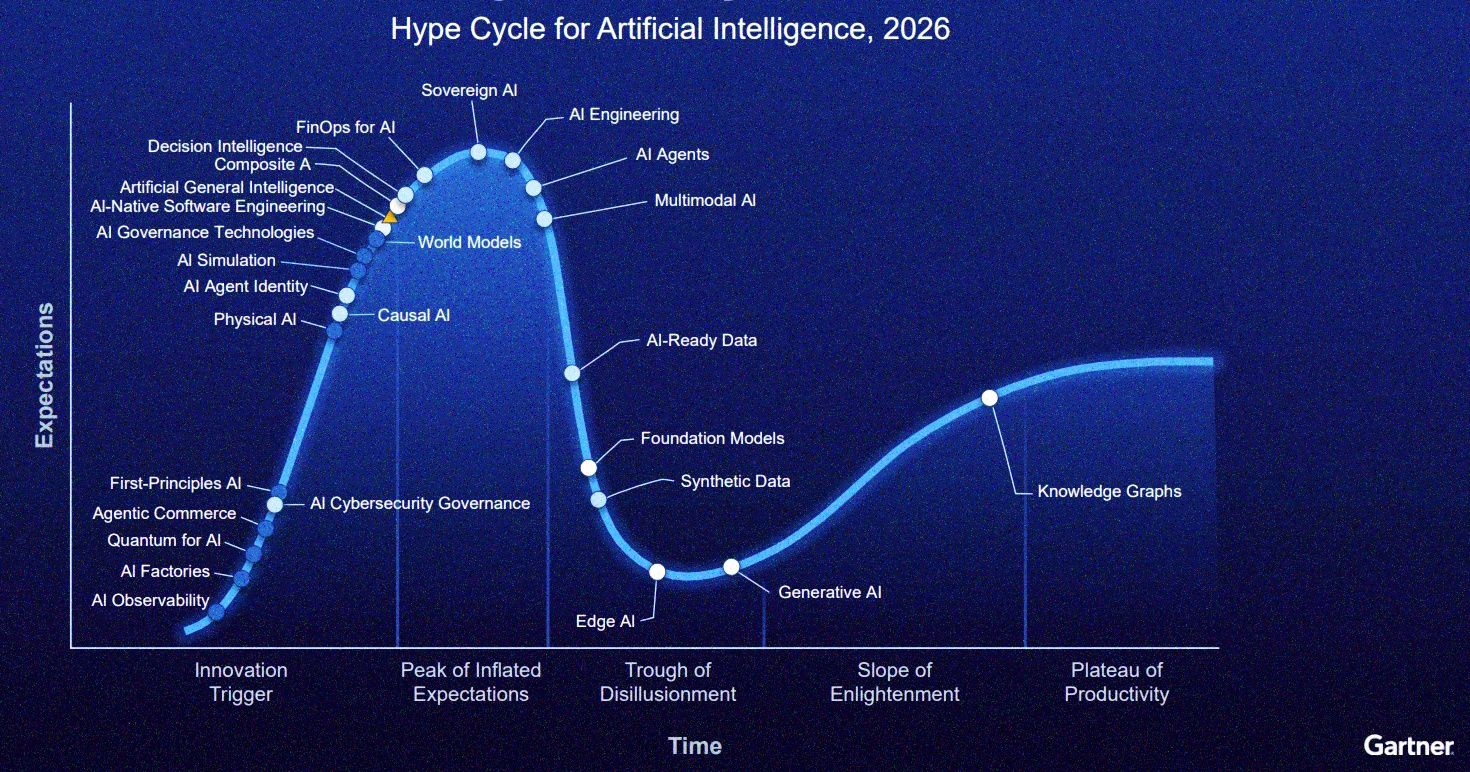
Gartner's original chart for 2026. The position shows the expectation phase. The legend of the original overview and the table below are used for exact time intervals. Source and full overview.
On the chart is 27 items. The following table translates their names and adds a brief factual explanation. The time estimates are overwritten from the marks in the original chart; the explanations of terms serve as a reader's glossary and do not replace Gartner's licensed definitions.
| Area | What to imagine under it | An estimate of the productivity plateau |
|---|---|---|
| Composite AI | Combining multiple approaches, such as learning from data, rules, optimization and knowledge structures. | Less than 2 years |
| Foundation models | Extensively pretrained models usable as the basis of many specialized applications. | Less than 2 years |
| Edge AI | Evaluation on a phone, machine, vehicle or local device close to the data source. | Less than 2 years |
| Generative AI | Systems that create text, image, sound, code and other content. | Less than 2 years |
| AI based on basic principles | Linking learning to physical laws, domain rules, and other known problem structure. | 2 to 5 years |
| Causal AI | Modeling causal relationships and consequences of interventions. | 2 to 5 years |
| Identity of AI agents | Recognition of a specific agent, his authority, represented person and responsibilities. | 2 to 5 years |
| Software development built from the ground up on AI | A development process in which AI is part of design, implementation, verification and maintenance. | 2 to 5 years |
| Decision-making intelligence | Linking data, models, decision rules and feedback on results. | 2 to 5 years |
| Financial management of AI operations | Continuous monitoring and optimization of AI costs relative to the achieved value. | 2 to 5 years |
| Sovereign AI | Control over data, models, infrastructure and dependencies on suppliers or jurisdictions. | 2 to 5 years |
| AI engineering | Practices for reliably building, deploying, evaluating, and operating AI systems. | 2 to 5 years |
| AI agents | Systems that select steps and use tools within a given goal. | 2 to 5 years |
| Multimodal AI | Models connecting multiple types of input or output, such as text, image, and sound. | 2 to 5 years |
| AI-ready data | Data of sufficient quality, available, described and legitimately usable for the given task. | 2 to 5 years |
| Synthetic data | Artificially generated examples for training, testing or simulation. | 2 to 5 years |
| Knowledge graphs | Structured capture of objects, their properties and mutual relationships. | 2 to 5 years |
| AI observability | Finding out what the system actually does, where it goes wrong, and how its behavior changes. | 5 to 10 years |
| AI factories | Computing, data and operational units for continuous creation and provision of AI. | 5 to 10 years |
| Quantum computing for AI | The use of quantum computing methods in AI-related tasks. | 5 to 10 years |
| Trading through agents | Selection, comparison or execution of business actions by software agents. | 5 to 10 years |
| AI Cybersecurity Management | Rules, Responsibilities and Control of Cyber Risks Associated with AI. | 5 to 10 years |
| AI in the physical world | Systems that sense the environment and intervene in it through machines and equipment. | 5 to 10 years |
| Simulation using AI | Connecting AI and simulations in modeling, testing and finding suitable procedures. | 5 to 10 years |
| Technology for managing and overseeing AI | Tools for system logging, rule enforcement, supervision and risk management. | 5 to 10 years |
| Models of the world | Models representing the environment and predicting its possible next states. | 5 to 10 years |
| Artificial general intelligence | Broadly generalizable intellectual abilities beyond narrowly defined tasks. | More than 10 years |
Timestamp source: original Gartner review, page 3. The sum represents four items in the shortest horizon, thirteen in the interval of two to five years, nine in the interval of five to ten years and one beyond the ten-year horizon.
The last line deserves special attention. The mark for general artificial intelligence expresses the distance to the productivity plateau in Gartner's model. It is not exactly a prediction of the date of the first general artificial intelligence. Moreover, the very definitions of what such a system would have to meet differ.
Also for knowledge graphs or combining methods, the horizon can surprise: their principles are older than the current wave of generative AI. The age of the method, the maturity of the product, and the scale of the particular deployment vary. But the question does not end there. If the same name and similar time estimate are repeated, we need to compare the original definition with the new one and see what has changed. I present a historical comparison below.
Similarly, the use of code generators cannot automatically be equated with developing software from the ground up based on AI. The second term can include changing the entire process: requirements specification, design, verification, deployment and maintenance. A research vision published in 2026 describes conversational app creation tools as an early manifestation of a broader transformation. Thus, the use of the assistant alone does not determine the maturity of the entire process; however, for forecast evaluation, this difference must be established in advance. A research vision of AI-based software development.
Six technology groups and the obstacles they face
A strong model does not guarantee a benefit.
Four ways a promising demo can lead to costly deployment, with checks for each risk.
A compelling but flawed answer
Verify data sources, timeliness and relevance.
Errors can compound
Restrict permissions and control important steps.
Cheap answer, expensive result
Include repetitions, corrections and human control.
Loss of experience and judgment
Maintain judgment, learning and knowledge of exceptions.
Own synthesis of the risks discussed in the article. This is not a probability of failure ranking.
For orientation, the 27 items can be divided into six subject areas. This breakdown is the reader's own synthesis, not another official Gartner classification. The categories overlap: for example, a multimodal model can be part of both a robot and an office assistant.
Knowledge models and representations. This includes basic, generative and multimodal models, knowledge graphs, combined and causal AI, models of the world or AI based on basic principles. A common question is how to combine the flexibility of learning with verifiable information and the limitations of a specific field.
The technical risk lies in mistaking persuasiveness for correctness. A linguistic model may suggest a plausible explanation without correctly capturing the cause. A knowledge graph can clarify relationships but contain outdated data. A physical constraint can improve machine modeling if it matches the actual operating mode. Each of these methods changes the nature of the errors; none by itself proves the correctness of the entire system.
The Agents and work automation. AI agent adds the ability to act to generate responses: search, select tools, perform operations, and react to the ongoing result. This also includes agent trading and the transformation of software development.
However, as the number of steps increases, the room for error increases. Consider a purely illustrative model: each of twenty independent steps succeeds with a probability of 98 percent, and all are necessary for the outcome. The probability of a flawless whole is then 0.98 per twentieth, i.e. approximately 67 percent. Actual errors are not independent and agents may correct some, so this is not a measure of their current reliability. The example shows the reliability claim of a multi-step procedure, not the long-term limit of AI capabilities. It works with a fixed error rate; real systems improve, use tests, and fix failed attempts. It is the METR measurements below that show that the length of independently manageable tasks is growing rapidly. Therefore, the current problem cannot be projected five years ahead without further ado. Go to the METR chart.
Data and simulations. Data quality includes correctness, timeliness, representativeness and significance in a specific process. The table may be without technical defects, but unsuitable for decisions: for example, it contains historical rules that are no longer used by the company. Synthetic data can complement rare situations, but at the same time it can repeat the blind spots of the model that created it.
Research by Shumailov and co-authors, published in the journal Nature in 2024, shows the risk of degradation when iteratively learning from model-generated data, including losing rare parts of the original distribution. This is a warning against a particular method of repeated training, not evidence that all synthetic data is harmful. For practice, it follows the need to trace the origin of the examples and verify the results on independent real data. A study on model collapse in recursive training.
Operation, supervision and security. This group includes AI engineering, observability, model and application management, agent identity, and cybersecurity. Gartner identifies observability as a significant new topic: routine availability monitoring may not detect a system that responds quickly but incorrectly. According to him, the current tool market remains fragmented. Gartner on AI observability and control.
The practical difference can be seen on the agent working with the invoices. We need to know which document he read, what data he took from it, with what authority he changed the record and who can approve the change. Noting that "the model responded successfully" does not address these issues. Similarly, it is necessary to distinguish a dangerous instruction embedded in a foreign document from a legitimate user input. Greater autonomy widens the implications of such confusion.
Economy, infrastructure and sovereignty. AI factories, financial management of its operation, local calculations, quantum methods and sovereign infrastructure solve different aspects of the question under which conditions AI can be operated in the long term.
From an economic point of view, it is more appropriate to measure the price of an accepted result than the price of a single answer. A cheap model may require many iterations and human corrections. A more expensive model may have a lower overall cost if it gets the job done right the first time. In the case of sovereignty, it is necessary to separate the location of data, control over their processing, availability of calculations and the possibility to change suppliers. The data center address alone does not address all these dependencies.
Therefore, for costs, Gartner recommends choosing the model level as needed, introducing individual run budgets and automatic stops when limits are exceeded. His argument is operational: consumption must be influenced already during system operation. Gartner to manage AI costs.
Physical systems. Robotics and other AI operating in the real world connect the model with sensors, motion control, mechanics and surrounding traffic. An error can be manifested by a damaged object or a dangerous movement. This is where probabilistic AI behavior meets the requirement of predictable security.
The reason for the longer horizon can be understood on the robot in the warehouse. It must recognize the package, grasp it safely, distinguish between an obstacle and a person, react to a sensor failure and cooperate with other machines. A better language model can improve the understanding of the instruction, but it will not solve all these limitations by itself. The following Gartner breakdown shows why you need to evaluate the entire system.
Why Gartner publishes separate reports for generative, agentic and physical AI
For the generative AI, Gartner distinguishes four areas in the public interpretation: models, engineering, agents and applications, infrastructure and support methods. Their purpose is to distinguish the model's ability from the ability to deliver a functional service. The same report forecasts that by 2028, at least half of generative AI projects will cost overruns due to inappropriate architecture and insufficient operational experience. Gartner's Generative AI Overview July 22, 2026.
An example of an architectural decision is whether to send each query to the largest model, or to distinguish between simple lookup, rule-based calculation, and complex analysis. Another is the extent of information attached to each request. Even with the decreasing cost of computation, the total consumption can grow if the application expands to more tasks, more users, and more repeated steps.
For the agentic AI, Gartner highlights the entire ecosystem: development and management platforms, agent coordination, communication, context management, development lifecycle, security and cost. In public interpretation, 17 percent of organizations have deployed agents and more than 60 percent plan to deploy in the next two years. The data comes from its survey of chief technology officers for 2026. But respondents' plans are not measured future adoption. Gartner's Agentic AI Overview.
It is useful for the reader to distinguish between an assistant, a hard-coded automation, and an agent. The assistant helps with each step. Automation follows a predetermined procedure. The agent can choose the next course of action according to the goal and the situation. A specific product can combine all three modes. Therefore, the designation "agent" does not in itself indicate the extent of autonomy or the necessary supervision.
For the physical AI, Gartner names five interconnected layers:
| Layer | What does it include |
|---|---|
| Physical systems | Robots, drones, autonomous vehicles and other devices. |
| Models and methods of intelligence | Perceiving the environment, planning and adapting behavior. |
| Data and simulations | Training materials, simulation twins and environment modeling. |
| Calculations and management | Local processing, sensors, responsiveness and infrastructure resilience. |
| Operational safety and coordination | Fleet surveillance, safe failover and industrial systems connectivity. |
According to Gartner, a weakness in one layer limits the whole. In particular, he draws attention to the difference between simulated and real environments and the difficulty of verifying more general physical autonomy. Gartner's interpretation of physical AI as of September 30, 2026.
For deployment, I draw a simple benchmark from this: don't just rate the best demo. Also check for lighting changes, unusual objects, missing data, connection drops, and uncertainty behavior. A managed average case does not speak enough about the safety of exceptional situations.
The future of work has its own map
The separate future of work curve for 2026 captures the status of July. Gartner unveiled it publicly in September. It contains 40 named topics, many of which are not technology-specific: they are also about skills, psychology, work roles and ways of working together. The original Future of Work chart.
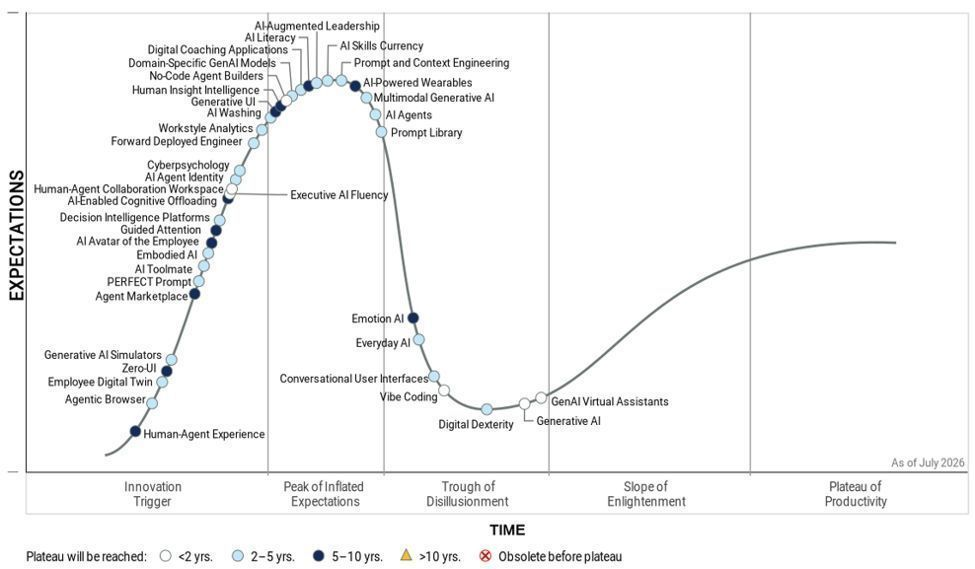
In addition to technology, the future of work also includes human capabilities and the organization of work. Source: Gartner, as of July 2026.
Gartner describes four main shifts towards it:
- Augment human capabilities through collaboration with AI. The focus is on judgment, creativity and responsibility.
- Build employees capable of continuous adaptation. It's not enough to master a tool once; tasks and required skills change.
- Strengthen the context, judgment and meaning of work. Organizations should maintain an understanding of why a particular procedure is used.
- Create conditions for subsequent benefits. Experience, infrastructure and skills are meant to cheapen and improve further use of AI.
Part of the message is a forecast that by 2027, three-quarters of organizations focused on turning AI productivity primarily into savings will be overtaken by competitors who return the benefits to innovation, modernization and education. However, the public report does not translate the concept of "overtaken" into a clear metric. Gartner on four changes to the future of work, September 9, 2026.
In order to find your way around the forty items, the following table groups them according to their practical context. Again, it is about the reader's own division. The table explains the original chart labels in plain language.
| Circuit | Chart items | The question they open |
|---|---|---|
| Collaboration of people and agents | A person's experience working with an agent; the shared working environment of people and agents; AI as a working partner; offloading cognitive tasks to AI; identity of agents; agent marketplace. | Which steps to delegate, how to keep track and who is responsible for the result? |
| Skills and leadership | Literacy in AI; practical knowledge of AI in senior managers; AI-assisted leadership; continuous skill update for AI; digital dexterity; digital coaching app. | Do people learn to use the tool and at the same time independently assess its outputs? |
| Knowledge of people and decision making | Analytics of work habits; working with human insight; cyber psychology; AI for emotion estimation; directing attention; decision intelligence platform. | Does measuring understanding help work or create misleading indicators? |
| Digital representation of the worker | AI employee avatar; employee's digital twin. | What is the representation allowed to do and how faithfully does it capture the capabilities and authorizations of a person? |
| Interface and access to tools | Interface without traditional controls; generated user interface; conversational interface; browser with agent functions; wearable devices with AI. | Does the user understand what the system will do and can they stop or fix it? |
| Creation of assignments and solutions | Creating agents without writing code; assignment and context design; assignment library; input methodology marked PERFECT; generating code by typing in natural language; an engineer working directly during the implementation of the solution at the customer. | How does a quick design turn into a maintainable and proven solution? |
| Application and model layer | Branch generative models; multimodal generative AI; AI agents; AI embodied in a device; simulators with generative AI; everyday use of AI; generative AI; virtual assistants with generative AI. | What kind of system is appropriate for the task and what conditions does it require? |
| Credibility of the offer | Marketing overuse of the AI label. | Is the promised capability provable, or is it mainly a new name for the product? |
For some titles, the public graph is considerably more concise than the actual tech profile. For example, in the case of the PERFECT label, the breakdown of abbreviations or specific methodology cannot be reliably deduced from the image itself. Similarly, "working with human insight" does not mean that there is a universally validated instrument for measuring human judgment. Such terms should be read as a definition of the subject being monitored.
What the work curve says about time
On the July chart, generative AI, its virtual assistants, and code generation by natural typing are labeled less than two years. For agents, domain models, multimodal generative AI, and digital agility, two to five years is. Human agent experience, agent marketplace, employee avatar, AI wearables and emotion estimation have five to ten years. These intervals are calculated from July 2026. Timestamps in the original working chart.
The contrast between the rapid expansion of code generation and the broader transformation of software engineering is striking. Prototyping and creating a well-managed service are different challenges. Similarly, an assistant can be added quickly to an office application, while decision-making, responsibilities and professional learning will take longer to transform.
Why is there so much talk about the loss of expertise and wrongful dismissals
The most prominent staff forecast says that the 30 percent of employees laid off and replaced by AI will need to be re-adopted by 2029, often at a higher cost. Gartner links it to insufficient planning for future work in its October announcement. In a July survey of 297 HR directors, only 19 percent of organizations identified planning practices as effective. Gartner forecast and research published on October 28, 2026.
The 30 percent prediction is not the result of observing the future year 2029. And the survey of 297 directors itself does not publicly demonstrate the calculation from which this proportion would be based. It is also important to keep the denominator: it is not 30 percent of all workers or a forecast of total unemployment.
Gartner highlighted the hidden personnel costs already in June 2026. In addition to re-recruitment, it mentioned the cost of rare skills, their rapid obsolescence and the mismatch between changed productivity and remuneration. In addition, the June formulation worked with a share of "up to 30 percent", while later communications state 30 percent. Gartner on the hidden costs of workforce change.
The risk mechanism can be explained without pretending to be accurate about this number. A workplace usually contains multiple activities. In addition to standard case processing, a person deals with exceptions, notices discrepancies, maintains relationships and passes on experience. If a firm only measures the speed of the routine part, it may underestimate the remaining work. When the employee leaves, the knowledge that was not recorded in the system also disappears.
Another possible problem is the thinning of entry-level professional positions. Simple tasks provide room for learning. Their automation can be beneficial, but the educational function must have a replacement. Otherwise, a short-term saving may be manifested years later by a lack of people capable of solving difficult cases. It is an organizational mechanism whose strength depends on the field and how AI is implemented, not an inevitable outcome of every automation.
A similar caution is required with cognitive facilitation. Help with research or a proposal can free up the capacity for more challenging thinking. However, passively receiving answers can weaken control. The difference is made by the workflow: whether one verifies the assumptions and argumentation, or just confirms the finished output. The American NIST classifies inappropriate trust, system dependence and other problems of arranging human cooperation with AI among the risks of generative systems. NIST Framework for Generative AI Risks.
Estimating emotions requires special caution
The inclusion of a technology in a forecast is not an endorsement of its scientific validity. Barrett and co-authors' review shows that the relationship between facial movements and emotions is highly situational, cultural, and person-specific. The same expression can accompany different states. Accurate detection of an expression therefore does not automatically result in an accurate determination of an emotion. A scientific review of the limits of facial emotion inference.
The EU AI Act also sets legal limits: Article 5 paragraph 1 letter f) of the European AI Act prohibits specified uses of AI to infer emotions in workplaces and educational institutions, with exceptions for health or safety purposes. A five- or ten-year market horizon cannot therefore be exchanged for future authorization to use the system in this way. The current consolidated version of the European regulation.
Specific forecasts and their dates
It is useful to supplement the time markers on the curves with separate quantitative forecasts. These data have different release dates, different denominators and different conditions. They cannot be added together or considered as one common statistic.
| Deadline | Gartner claims | How to understand them correctly |
|---|---|---|
| End of 2027 | More than 40 percent of agentic AI projects will be canceled due to cost, unclear value or insufficient risk management. | The forecast concerns the share of projects that will be canceled. |
| The year 2028 | At least 15 percent of daily work decisions will be made autonomously by agentic AI. | A view of decision-making, not a percentage of all jobs. |
| The year 2028 | Agentic AI will be part of 33 percent of enterprise software applications. | The presence of a function in an application does not indicate how extensively or autonomously the customer uses it. |
All three mentioned forecasts have already been published by Gartner June 25, 2025. Their repetition in the materials of 2026 is a reminder of the older estimate. At the same time, Gartner warned against renaming common assistants and automation to agent products. Original predictions about agentic AI.
Next to them are this year's already mentioned outlooks: exceeding the budget of at least half of the generative projects by 2028, the possible re-admission of laid-off people by 2029 and the competitive advantage of reinvesting benefits by 2027. Everyone is looking at a different part of the problem: implementation costs, personnel planning or a productivity utilization strategy.
The latest job outlook to 2030
On November 10, 2026 Gartner released another forecast. By 2030, he expects the creation of 10.6 million AI-related jobs and the disappearance of 8.9 million, i.e. a net gain of 1.7 million seats. He independently works with five million pending opportunities to recruit or create positions. It emphasizes the differences between disciplines and the transformation of work even where the position does not disappear. Gartner employment forecast as of November 10, 2026.
A positive global balance does not mean that change will be favorable for everyone. A new position may arise in a different country, require different skills, or be available only after a longer period of time. Moreover, the delayed creation of a position represents a different phenomenon than the dismissal of a person from an existing position. Therefore, these categories cannot simply be subtracted from each other without knowledge of the methodology.
Even this outlook alone does not verify the earlier forecast of rehiring 30 percent of the laid off. One describes the overall job flows, the other a specific group of affected employees. They may be logically compatible at the same time, but each needs its own empirical verification.
Alternative forecasts of major analyst companies
Five numbers. Five different questions.
The growth of AI use may accompany the disruption of projects. Institutions monitor different quantities.
Agent projects are to be cancelled.
Projects count, not jobs.
Enterprises are supposed to operate most processes primarily with the help of AI.
People should continue to supervise and take decisions.
Enterprise technology spending is expected to fall on AI.
Expenditure alone does not demonstrate return.
A basic estimate of the autonomous agent market.
Up to 45 billion is a conditional favorable scenario.
Respondents from organizations using AI report a decline in employment attributed to AI.
A year earlier, 32% expected it. It is not about the share of eliminated jobs.
Numbers cannot be directly compared or added up. The monitored population, period and methodology differ. Details and links to original sources are in the following sections.
Comparing different institutions is only useful if we preserve the differences between their questions. Market growth, project return, number of businesses using AI and number of jobs are different quantities. A high proportion of failed attempts can coexist with a rapid proliferation of successful applications.
| Institution and background | What it measures | Main forecast or finding | Nature of evidence |
|---|---|---|---|
| IDC, outlook for 2027 | Business processes | By 2029, 60 percent of businesses are expected to operate most processes with AI as a core way of doing work. | Analytical forecast |
| Forrester, 2027 predictions | Expenses and corporate environment readiness | AI to account for a fifth of enterprise technology spending in 2027; only a quarter of enterprise context layer initiatives are expected to reach production scale. | Analytical forecasts |
| Deloitte, Technology Outlook 2026 | Autonomous agent market | The base market estimate for 2030 is $35 billion; the conditional option reaches approximately 45 billion. | Summary of market estimates and conditional scenario |
| McKinsey, The State of AI in 2026 | Experience of employment organizations | A decrease in staff attributed to AI was reported by 14 percent of respondents; in the previous year, 32 percent expected it. | Questionnaire findings |
IDC predicts a faster transformation of business processes
In an outlook published at the end of October 2026, IDC expects that by 2029, the 60 percent of businesses will operate most processes in a manner in which work is primarily handled by AI. For the year 2026, it states 13 percent. Agents are supposed to do the work and people are supposed to help, supervise and take decisions according to the set rules. The public explanation does not provide an uncertainty interval for this prediction. IDC on the outlook for 2027 and beyond.
This is an ambitious outlook for the speed of organizational change. However, it cannot be directly deducted from Gartner's canceled agent projects: IDC counts enterprises and the shape of their processes, Gartner projects. A company can end several attempts and at the same time expand a successful solution. A crucial question for IDC's later validation will be how "most processes" are measured and how large a proportion of the work is actually being taken over by AI.
Forrester expects high investment and difficult work with context
In October 2026, Forrester predicted that by 2027, AI would account for one in five dollars of enterprise technology spending. This is a market estimate, not a mandatory twenty percent share in the budget of each company. At the same time, he expects that only a quarter of initiatives building the enterprise context layer will be able to support agentic AI at production scale. Forrester's predictions for 2027.
The context layer can be used to imagine the way in which an agent obtains meaningfully correct information about a business: what a particular record means, who is authorized to use it, and how it is related to other data. A practical obstacle can thus lie between a powerful model and a disorganized corporate environment. Forrester's combination of spending growth and limited deployment success is a reminder of why investment volume cannot be mistaken for proven value.
Deloitte shows the difference between the baseline estimate and the favorable scenario
Deloitte, in its 2026 outlook, released on November 18, 2025, works with the average of market estimates for autonomous AI agents: $8.5 billion in 2026 and $35 billion in 2030. Adds a custom conditional scenario. Better coordination of agents and risk management could increase the market outlook by 15 to 30 percent, to about $45 billion. Deloitte on agent coordination and their market outlook.
Therefore, the amount of 45 billion cannot be presented as a certain result. It is connected with the condition that part of the operational obstacles can be solved. Moreover, supplier revenues are not the same as customer benefits or economy-wide productivity. This forecast is useful for considering field size, but is not a substitute for calculating a specific deployment.
McKinsey compares layoff expectations with subsequent experience
In a report dated August 25, 2026, McKinsey says that 14 percent of respondents from organizations using AI reported its contribution to the overall decline in the number of employees during the previous year. A year earlier, 32 percent expected such a decline. Newly, 39 percent expect it for the following year. The survey included 1,719 participants from 97 countries; the authors also examined a group of 552 people present in both years and report the same basic conclusion. McKinsey on the state of AI in 2026.
This is a particularly valuable addition to forecasting: expectations can be compared with later reported experience. It is still about the answers of the respondents, not about the accounting records of all the disappeared places. And the proportion of organizations in which something has changed does not reflect the number of workers affected. Nevertheless, the results show that managerial expectations may be ahead of the actual extent of change.
General AI: why manufacturers and Gartner seem to be a decade apart
In March 2025, Anthropic expected very powerful systems in late 2026 or early 2027. It described cross-disciplinary capabilities as well as independent solutions to long tasks. It is a manufacturer's dated forecast with its own definition of the target. Anthropic's original forecast.
In a May 2026 interview, Demis Hassabis of Google DeepMind talked about AGI around 2030, allowing for 2029. Even this statement is not identical to an estimate of broad enterprise productivity. Interview with Demis Hassabis.
| Statement | What does it predict? | How to read it |
|---|---|---|
| Anthropic, March 2025: late 2026 / early 2027 | The emergence of systems with specifically described very high capabilities. | Manufacturer's forecast; the date alone does not demonstrate the attainment of capabilities. |
| Hassabis, May 2026: around 2030, possibly 2029 | Achieving general intelligence. | Dated opinion of the head of the research laboratory. |
| Gartner, August 2026: more than a decade | AGI Category Productivity Platform. | It is not exactly the date of the first system. |
Therefore, Gartner's mark cannot be rewritten to say that AGI cannot occur before 2036. The different goal of the prediction explains part of the discrepancy, but does not automatically defend either term. Producers have access to internal results, but also business interests. Analytics companies, on the other hand, observe enterprise deployment and have their own business model. For comparison, we need a common definition of capabilities, the probability of their achievement and a fixed date of evaluation.
The World Economic Forum offers another perspective on employment
The World Economic Forum is not a direct competitor to Gartner in technology consulting, but its jobs report makes for a useful comparison. For the period 2025 to 2030, 170 million jobs created and 92 million jobs lost reports as a result of the confluence of technological, demographic, economic and other changes. These numbers cannot be entirely attributed to AI.
For the narrower category of AI and information processing technology, it lists approximately 11 million jobs created and 9 million jobs lost. This outlook is closer to Gartner's November comparison, but still uses different definitions and methodology. The analysis links employers' expectations with labor market statistics. The occupations covered correspond to approximately 1.18 billion workers, and the report does not explicitly claim to cover all global employment. World Economic Forum, Jobs Outlook 2025.
The similarity of net additions of around two million for this narrower category and 1.7 million for Gartner is interesting. However, it is not in itself proof of accuracy. For a true comparison, we would have to unify the starting population, period, job definition, and way of attributing AI changes.
The common picture of these estimates is quite understandable: strong interest and increasing investment can accompany slower work transformation and large differences between successful and unsuccessful organizations. They differ mainly in speed and in what part of this process they measure.
What independent research says
A scientific approach requires distinguishing between market forecasting, the intention of the respondent in the questionnaire, observation in the enterprise and experiment. Each type of evidence answers a different question.
METR: how quickly the ability to complete tasks independently grows
METR measures the length of tasks by the time of a human expert and estimates how long an agent will complete them with 50% or 80% success rate. It's not about its continuous run time. The tests consist mainly of well-defined tasks from software engineering, machine learning and cyber security. METR time horizon definition.
AI can complete increasingly long tasks on its own
The two levels of success show the growth in ability as well as the difference between success in half and in four fifths of cases.
On a narrower screen, the chart can be moved to the side.
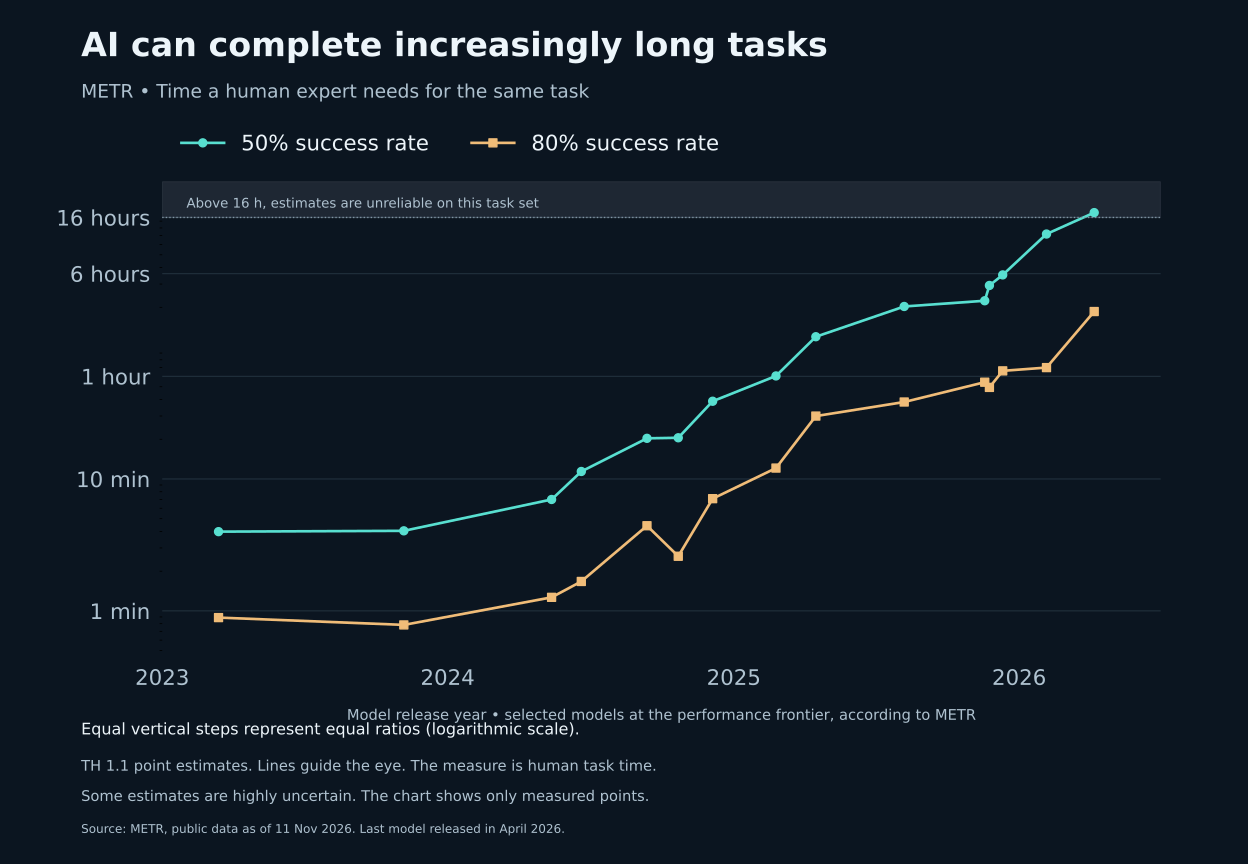
Growth is the measurement, trend continuation is the assumption. It's a person's time for the same task. The current test set already measures values above 16 hours unreliably.
Own graph of public data METR TH 1.1, downloaded on 11/11/2026. Selected records marked METR as the then performance limits. The chart uses later point estimates; the doubling times listed are from publication of 1/29/2026.In a January update, METR described roughly exponential growth: doubling in about seven months in the long run and in 131 days under the newer methodology for the period from 2023. The composition of the tasks affects the result, the uncertainty intervals remain wide, and some of the human times are estimated. Methodology and task set changes.
The graph shows later published measurements, not a reconstruction of the January result. As of September 2026, METR marks the overview as not actively updated; the last model in the file used is from April. So it is not a complete list of models available in November. The point estimates shown have uncertainty and do not promise the same high performance on vaguely specified routine work. Overview status and limitations.
It is essential for forecasts that we cannot freeze the current rate of error and explain the distant future on its basis. In the same way, the date of the replacement of a certain profession cannot be unconditionally derived from the existing exponential. We need to monitor whether the growth continues, whether it transfers to more difficult tasks and how much control the achieved result requires.
Anthropic: which work tasks are exposed to AI
A March 5, 2026 study by Maxim Massenkoff and Peter McCrory combines American occupation descriptions, language model capability estimates, and Claude usage. Its indicator gives greater weight to automated use than to assisted use. It compares the theoretical possibilities with the observed task coverage in the radar chart. For readability, I present here a bar chart of the ten most exposed professions from public data. Anthropic studies and original charts.
AI exposure is not a predictor of layoffs
Ten occupations with the highest task coverage on Anthropic’s measure.
On a narrower screen, the chart can be moved to the side.
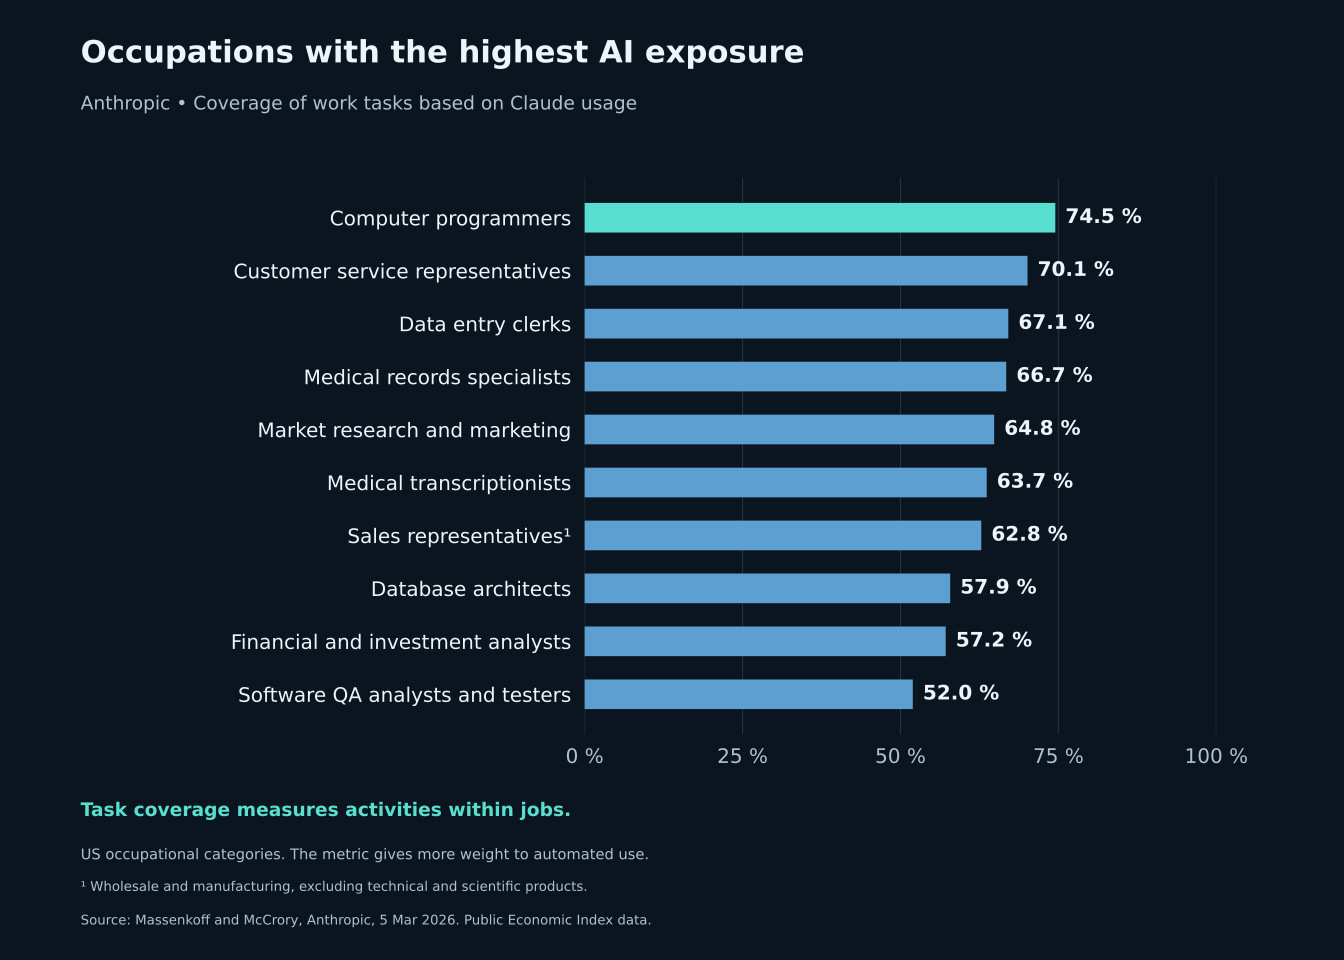
The percentage refers to tasks within a job. One profession combines various activities. Also, single provider usage data does not cover the entire AI market.
Our chart uses Anthropic Economic Index data, file job_exposure.csv (CC BY). Profession names are translated and abbreviated. The pair of 94% and 33% comes from original study; it refers to a wider group than programmers themselves.In this March study, the authors did not find a systematic increase in unemployment among the most exposed workers. However, they described preliminary signs of weaker acceptance among young people. This is not a guarantee of future development or proof that no place has disappeared. Results and limitations of the study.
In addition to layoffs, I find it useful to monitor recruitment, changes in job description, and wages. A company can handle the same amount of work without a planned new employee without laying off anyone. Or he can use the savings to expand the service. The exposure score alone does not decide between these scenarios.
Productivity in a particular job may have a different development
A study by Brynjolfsson, Li, and Raymond published in 2025 in the Quarterly Journal of Economics analyzed the rollout of the Assistant at 5,172 customer support staff. The number of cases solved per hour increased by 15 percent on average, with the benefit strongly dependent on worker experience. The result demonstrates the benefit of a specific work arrangement, but is not an estimate of the impact on the employment of the entire economy. An empirical study of generative AI at work.
Another picture was provided by METR's experiment with tools from the first half of 2025. Sixteen experienced developers solved 246 real tasks in known projects. With AI enabled, jobs took 19 percent longer on average. At the same time, the participants subjectively perceived the acceleration. The result highlights the difference between the feeling of productivity and the measured time; its validity is limited by the tools, people and tasks of the time. The 2025 METR randomized trial.
That is why it is important to provide more recent information. In February 2026, METR reported on continuing research showing signs of acceleration, but also severe selection bias: some developers did not want to participate in an experiment requiring non-AI work, and the selection of tasks was also changing. Therefore, the authors did not consider a simple summary estimate to be a reliable picture of current benefit. Older slowdowns cannot be taken as a general verdict on today's programming. METR update and research procedure change.
An even more recent METR assessment of November 5, 2026 by Anthropic suggests a significant acceleration in the development of AI capabilities. However, the authors explicitly draw attention to the high level of uncertainty and editorial interventions that do not allow the public to assess a substantial part of the documents. This is a valuable example of why its record limitations should be published with the conclusion. Furthermore, the acceleration of research within one AI lab cannot be directly translated into the productivity of every enterprise. METR Independent Assessment November 2026.
These results are not necessarily mutually exclusive. AI can significantly assist a less experienced human in a standardized task while adding control work to an expert in a complex environment. It can also change which tasks people start doing in the first place. It is the differences between people, tasks and work processes that explain why a single universal productivity number is of little use.
Fifteen years in retrospect: eight different stories of AI
I have been following Gartner for several years, but to assess its estimates I went back even further: to the documents from the 2011–2026 period. The two adjacent vintages show a rather minor update. A greater distance will help to know whether the original expectation was really approaching fulfillment. And one selected case is not enough: in addition to the postponed deadlines, we also need to see progress towards maturity and changes in the categories themselves.
How far the available documents go
Gartner uses the expectation curve from in 1995. In his own press release from 2011, he recalled that speech recognition was already on the first curve and was not yet fully developed at that time. So the history is longer than thirty years, but it does not mean thirty years of one unchanging database of all today's categories. Gartner press release dated August 10, 2011, archived reprint.
For this article, I looked for a complete general overview of the new technologies of the year 2011. The revision history of Gartner's AI report further demonstrates the follow-up series: smart machines in 2014–2016, artificial intelligence under this name since 2017. Public reprints of reports, original presentations, charts and press releases are available. However, full profiles of all vintages are not equally readily available. 2011 report, revision history in report 2023, page 108.
Eight cases with larger control point spacings follow. Fifteen years indicates the span of the underlyings used, not a fifteen-year continuous streak of each item. Newer concepts cannot be mapped back into old charts. I always count the time stamps from the year of the particular estimate; I state the position on the curve separately.
Older concepts: maturity, long wait and change of division
Older curves don't tell one story
Four long-term monitored areas. For each, the year and the estimate or change in classification at the time is given.
Progress to maturity
2011: 2–5 years
2017: platform point, under 2 mark
2020: move to language report
The horizon is getting shorter
2017: 5-10 years
2020: 2-5 years
2023: less than 2 years
The category is divided
2017: 5-10 years
2021: 5-10 years
2023: split into multiple technologies
Still behind the decade
2017: more than 10 years
2021: more than 10 years
2026: more than 10 years
Disappearing from the chart is not a test result. It can mean maturity, transfer, renaming or division. In addition, for AGI, the open interval does not determine the final year of fulfillment.
Custom comparison of original Gartner data from 2011, 2017, 2020, 2021, 2023 and 2026. Details and links follow.1. Speech recognition: a long history, but also a demonstrable progress. In the 2011 matrix, it had a horizon of 2–5 years. On the 2017 AI curve, its point is already in the area of the productivity plateau, with a marker indicating less than two years to the plateau. The 2020 report explains its subsequent removal from the general AI map by moving into a specialized line for language technologies. This is an important counter-example to the claim that all technology just moves forward indefinitely. The exact year of fulfillment of the original estimate cannot be determined from these three points alone. Matrix 2011, page 11, Gartner 2017 Chart Presentation, Page 3, explanation of the move in the 2020 report, page 7.
2. Computer vision: an example of time-compatible development. 5-10 years left in 2017, 2-5 years in 2020 and less than two years in 2023. The original calendar window of 2022-2027 and the later outlook to around 2025 do not contradict each other. We don't see the same pushback here as with composite AI. This is in line with Gartner's own estimates; independent confirmation of true market maturity would require another benchmark. 2017 chart, matrix 2020, matrix 2023, Annex 1A.
3. Natural language processing: same interval, then category change. It has a horizon of 5-10 years in 2017 and 2021. So four years passed, but the remaining interval did not shorten. In 2023, the item disappears from the AI map; the report explicitly states the division into multiple technologies in a specialized language overview. Neither fulfillment nor failure of the prediction can be inferred from this step. Nor can today's generative AI continue without further ado as if it were an unchanged item. 2017 chart, chart 2021, explanation of change in report 2023, page 5.
4. General artificial intelligence: nine years with the same open border. In 2017, 2021 and 2026, AGI has the "more than ten years" mark. Its calendar significance shifts beyond 2027, 2031 and 2036. It is a weakly verifiable outlook: the 2017 claim did not promise to be reached in 2027, but more than ten years from now. It is therefore not a case of three proven errors. A legitimate question is how much new information such a repeated estimate brings and how Gartner evaluates the change in the probability of the arrival of AGI. 2017 chart, chart 2021, overview 2026, page 3.
Composite AI and other newer concepts: a review after three years
For me, the example of composite AI is the most personal. When I read about combining learning, rules, knowledge structures and optimization, it reminds me of earlier debates about hybrid artificial intelligence. Gartner itself refers to combined and hybrid AI as alternative names in 2025. But this does not prove the existence of the same time profile before 2020. Gartner's explanation of the relationship between the two names.
In the tracked AI series, composite AI is newly included in 2020. At the same time, the profile at the time itself acknowledges that the basic ideas are not new. Therefore, I do not artificially extend its forecast history to fifteen years. I am comparing the 2020 → 2023 → 2026, i.e. the same three-year intervals. Report 2020: new items and profile of composite AI.
Six years have passed. The goal is still ahead of us.
The same category at regular three-year intervals. The cards show the remaining time to the productivity plateau at that time.
2022–2025
2025–2028
until approximately 2028
The 2020 window has already ended. On the other hand, the outlooks for 2023 and 2026 overlap. So it's not the same shift with every update.
Custom comparison of Gartner reports from July 2020, July 2023, and August 2026. Calendar years are approximate; the graphs themselves do not determine the cause of the changes.| Area | 2020: remaining time | 2023: remaining time | 2026: remaining time |
|---|---|---|---|
| 5. Composite AI | 2-5 years | 2-5 years | Less than 2 years |
| 6. Generative AI | 2-5 years | 2-5 years | Less than 2 years |
| 7. AI directly in devices | 2-5 years | Less than 2 years | Less than 2 years |
| 8. Knowledge graphs | 5-10 years | 2-5 years | 2-5 years |
Timestamp sources: matrix 2020, page 6, matrix 2023, Annex 1A, overview 2026, page 3.
Composite and generative AI: the original 2020 window ended around 2025. According to the 2026 map, the plateau is still ahead. This is a demonstrable mismatch of the original time window with the later assessment. At the same time, generative AI represents an early recognized topic before the mass use of conversational models. Recognizing the importance of a topic and timing its maturity are two different accomplishments.
AI directly in devices: shift can also be seen between 2023 and 2026. Already in 2023, the plateau was expected in less than two years, i.e. until approximately 2025. In 2026, the category has yet to reach it. This is a more specific stimulus for retrospective explanation than the general impression that all terms are shifting.
Knowledge Graphs: picture is less clear. The original 2025-2030 window and the new 2028-2031 window overlap significantly. Between 2023 and 2026, the interval of 2-5 years will repeat itself, but it would not be fair to label the entire original forecast as refuted.
Eight cases show why I wouldn't write that Gartner "never hits anything." We see progression to maturity, overlapping estimates, shifts beyond the original window, and breakdown of categories. It is a comparison of historical statements, not a calculation of the success of all forecasts. Moreover, the same name does not guarantee an invariant definition. Only a comparison of full profiles and independent results can explain the difference between misestimation, market change and definition change. This is exactly the kind of explanation I would expect from the new edition.
How to scientifically evaluate Gartner itself
Gartner curves have value as an organized overview of topics and analytics expectations. However, they do not provide experimental evidence that each technology will follow the same path. In a 2016 study, Dedehayir and Steinert already described inconsistencies when empirically examining the model on Gartner's own records. Expert study on the possibilities and limitations of the expectation curve model.
I would therefore require four things to assess a specific prediction. First, a precise definition of the observed phenomenon: for example, what counts as an agent project and when it is considered cancelled. Second, the starting population and method of data selection. For the third degree of uncertainty and the conditions under which the forecast is valid. Fourth, a later evaluation against a predetermined criterion.
The prediction "40 percent of projects will finish by a certain date" can be testable if there is a defined group of projects and tracking rules. Claims that firms will be "outcompeted" are more difficult to evaluate until it is determined whether it is sales, profitability, productivity or market share. A precisely printed percentage is not a substitute for a precise definition of the measured quantity.
Similarly, it is necessary to guard the relationship of cause and connection. If organizations with good planning are more likely to exceed economic goals, planning may contribute to the result, but so may more capable leadership, higher investment capacity, or other characteristics. Without an appropriate research design, the magnitude of the association cannot be automatically interpreted as the effect of a single managerial change.
An honest historical audit would track a pre-selected set of categories including those that later disappeared or changed names. It would retain the original definitions, convert relative horizons to fixed dates, and use an independent measure of maturity. The result should also be compared with a simple estimate without analytical expertise. Only then can one determine whether the curve adds predictive value beyond the normal expectation of gradual expansion.
Experience with the curve is therefore best used as a source of hypotheses. If Gartner highlights agents' cost uncertainty, it's worth measuring. If it points to the loss of context in automation, it's worth watching for exceptions and knowledge passing. However, the validity of a particular decision must be demonstrated by the results in the environment for which we are deciding.
What to draw from the forecasts for your own organization
The first step should be to define the task and the outcome. Instead of the vague goal of "implementing agents", for example, the processing time of a certain type of request can be monitored while maintaining the same quality. Time for inspection, repairs, operating costs, and exception handling work must be calculated at the same time.
The second step is the comparison with the initial state. If conditions permit, it is advisable to divide comparable tasks or teams between different procedures and to determine benchmarks in advance. Otherwise, there is a risk that we will label a change in the composition of cases, greater experience of workers or the selection of simpler tasks as the contribution of AI.
The third step is the gradation of autonomy. Draft response, internal record change, and irreversible operation have different severities. The scope of permissions should match the consequences of the error. Experience from reliable narrow deployment can then underpin further expansion.
The fourth step is to monitor people's abilities. Saving time is more valuable if it enables better work, new services or learning. When it turns into just more uncontrolled output, apparent activity can grow without a corresponding improvement in output.
So the most beneficial reading of Gartner's forecasts lies in asking specific questions: Do we have the right data for the decision at hand? Can we spot the error? Do we know how much the received result costs? Is there a person in the organization who is able to assess the situation independently? And do we measure the same quantity after the introduction as before?
The answers to these questions determine whether technological advances translate into value. The curve helps to pinpoint areas to pay attention to. The effectiveness of a specific solution is determined only by its verified operation.
Our critical reflection: what we take from the forecasts and what we don't believe yet
After following it for several years, I have a dual relationship with Gartner. I appreciate that he can juxtapose models, data, work organization and operational responsibility. I'm more careful about the time estimates themselves. The examples of composite AI and AI directly in devices are the reason for me to ask for an explanation of the shift. The history of speech recognition and computer vision simultaneously shows progress toward maturity. Criticism should distinguish individual results and preserve the original terms, not select only cases that suit it.
What a good prognosis should hold
Our criteria for Gartner, model makers and our own estimates.
What exactly is supposed to happen?
Model capability, scale in firms, and economic impact have different metrics.
What came out last time?
Let's compare the new terms with the original ones, including changes in names and definitions.
How fast are the options changing?
Today's restrictions are not fixed. But an exponential trend is not a guarantee of the future.
What would change our mind?
Predetermined result, date and continuously available measurement.
We use Gartner's map for orientation. We also base our decisions on capability measurements, the results of specific deployments, and the evaluation of past estimates.
I consider the weakest point to be the unclear relationship between the time estimate and the condition for its fulfillment. If the technology is already in widespread use, but the platform is still ahead, we need to know what is still missing. It may be a legitimate demand for economic maturity. However, without a predetermined criterion, the threshold for success may shift along with the prognosis.
I would emphasize the pace of technical progress more in the assessment. From the shape of Gartner's curve, it cannot be concluded that he is working with a linear model of time. In this year's commentary, he himself talks about technology advancing faster than he expected. But the public graph does not show the calculation by which this acceleration is projected into individual horizons. Gartner Commentary on 2026.
The METR measurement is an important counterweight in this regard. It makes us wonder if the problem that limits autonomy today will persist in several model generations. At the same time, I would not automatically project the same speed to the whole economy: the change in model capabilities, business process redesign and the measurable impact on employment may evolve differently. AI can also accelerate the implementation of other systems; but we have to verify the size of this effect.
The optimistic promises of manufacturers deserve the same strictness. Access to the latest models is valuable information, not a guarantee of accuracy. For AGI we need a clear definition and test date. For jobs, we need to distinguish between reassignment, hiring restrictions, and actual job loss. No impressive visualization can make up for these differences.
Our conclusion is therefore deliberately tentative: Gartner offers a useful overview of topics, but without proven historical accuracy we do not credit it with the authority of a reliable AI development calendar. More weight is given to transparent measurements and estimates, where both success and error can be recognized retrospectively. If it turns out that Gartner, after unifying the definitions and making a full historical comparison, estimates the terms well, it is appropriate to change the opinion. Likewise, we will need to adjust expectations of rapid automation if the growth of capabilities slows or does not translate into regular work.